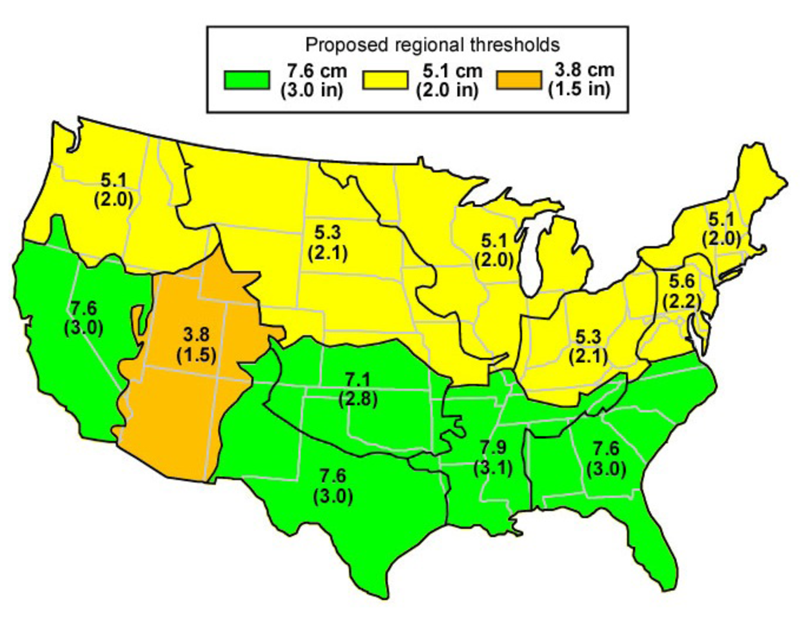
Figure 14 from the paper. CONUS NWS RFC regional thresholds for daily
precipitation amounts recommended for future use by NWS in tracking QPF
performance in high-impact extreme precipitation events. In each
RFC region, the upper number is the threshold of the top 1% of
precipitation events over the period from 1950-2007 in centimeters and
the bottom number is in inches.
|
HMT Publication Notice
This paper uses observations and forecasts from the HMT-West 2005/06 field season to examine operational forecast skill in heavy rainfall events, as part of HMT's Quantitative Precipitation Forecasting (QPF) Major Activity Area. The research team included staff from NOAA/PSD, NWS forecast offices and USGS. The results highlight the challenge of predicting the location and magnitude of extreme rainfall, as well as differences between forecasts for the Pacific Northwest and California. It was also found that 16 of the 18 most extreme events were associated with atmospheric river conditions. Analysis of the regional distributions of nearly 30 million COOP observations of precipitation over >50 years over the contiguous U.S. led to a recommendation for a new method of measuring QPF performance based on objectively defined thresholds of extreme precipitation applicable to each of NWS, River Forecast Centers, domains (Figure).