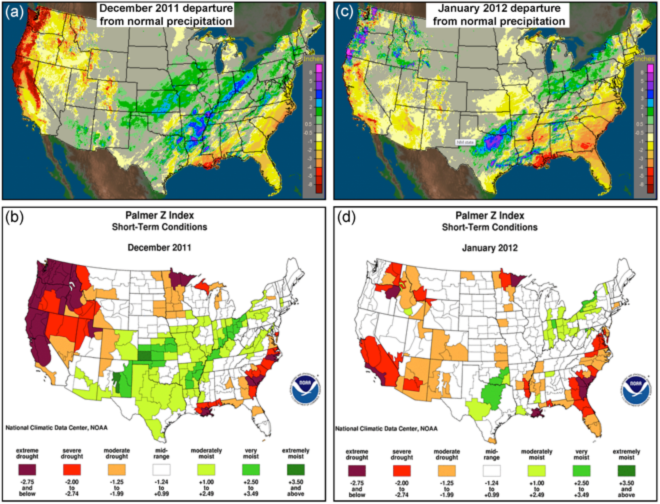
(a) The observed departure from normal precipitation for December 2011 (Image courtesy NWS/AHPS). (b) The Palmer Z index, which measures the departure of monthly moisture conditions from normal, for December 2011 (Image courtesy NOAA/NCDC). (c) Same as (a), except for January 2012. (d) Same as (b), except for January 2012.
Hydrographs showing observed gauge height at (a) the Marys River near Philomath, OR, and (b) the Smith River near Crescent City, CA. The green shaded regions denote the period of heavy precipitation and AR conditions.
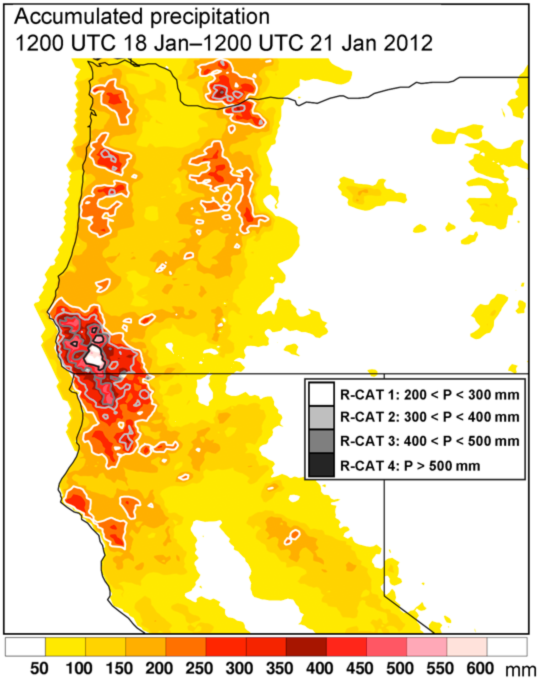
Accumulated precipitation during 18-21 January 2012 using the quantitative precipitation estimate product. Precipitation thresholds corresponding to the four rainfall categories (R-Cats) are contoured according to the legend.
Atmospheric Rivers Help Alleviate Dry Spell in Oregon and California
During the late fall and early winter of 2011, the U.S. West Coast
experienced extremely dry conditions resulting in a short-term drought.
Relief came between 18-21 January 2012, from major storm activity over the eastern
North Pacific. This stormy period featured two prominent atmospheric rivers
(ARs) and led to heavy rain and snowfall over the coastal mountains of the
Pacific Northwest and California. The highest precipitation totals were
observed in southwestern Oregon and northwestern California, with 'extreme rainfall'
accumulations that exceded 24 inches. Ongoing research by the Hydrometeorology Testbed (HMT) has helped prove
that storms involving ARs are more likely to produce dangerous floods that
cause property damage and loss of life. However, instances of heavy
precipitation can also be beneficial in replenishing water supplies and
alleviating drought conditions in agricultural regions and population
centers along the west coast.
In the days leading up to the January storm, numerical weather models
alerted forecasters at local National Weather Service (NWS) offices and the
Hydrometeorological Prediction Center (HPC) to the potential for a
long-duration AR event along the U.S. West Coast. As active participants in
HMT, NWS and HPC forecasters recognized the potential impact of a
long-duration AR event over the mountainous terrain of Oregon and
California. Quantitative precipitation forecast (QPF) guidance helped
forecasters to anticipate the location and magnitude of the extreme
precipitation. Based on this information, the California-Nevada River
Forecast Center (CNRFC) and the Northwest River Forecast Center (NWRFC)
were able to issue successful river flow forecasts, which accurately
captured both the size and the timing of peak flows.
As of early March, the northern Sierra Nevada had received 18.3 inches of precipitation, which
is 50% of normal for this point in the water year. Of the 18.3 inches, roughly 7
inches fell during the January storm. This represents 37% of the
precipitation for the entire water year-to-date, which is consistent with
research findings that a few AR events in a water year in this region
generally account for 40-50% of the total precipitation for that year.
However, in this case, being a very dry year, it has only taken this one
stormy period with its two ARs to do so.