|
|
Click image for more detail | |
|
Contact: Marty Ralph
|
|
HMT Publication Notice
Strong winter storms battered the U.S. West Coast from Western Washington to Southern California in December 2010, producing as much as 250-670 mm (10-26 in. of rain) in mountainous areas (see figure). A common denominator among these events is that the synoptic weather patterns produced a series of strong atmospheric rivers (ARs) that transported large amounts of water vapor from over the Pacific Ocean to the U.S. West Coast.
Just how extreme were these events relative to other AR cases in the region? More generally, how does West Coast AR-fed precipitation compare with extreme precipitation in other parts of the United States, such as from landfalling hurricanes and tropical storms? This study uses decades of Cooperative Observer (COOP) daily precipitation reports from more than 5,800 stations across the United States to address these questions and provides an analysis of these December 2010 West Coast events and their associated weather forecasts.
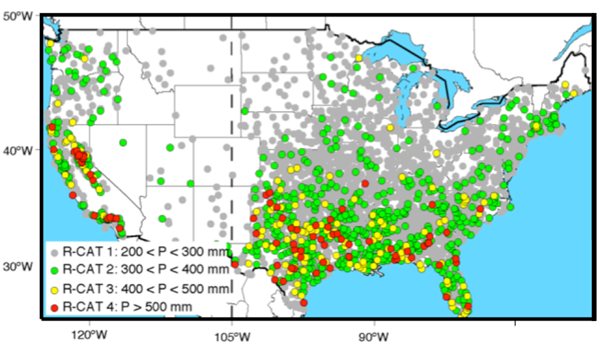
The method developed here to rank rainfall events is based on a simple scaling that uses 72-h total precipitation accumulations. The scale has four Rainfall Categories (i.e., R-Cat 1 = 200-299 mm, R-Cat 2 = 300-399 mm, R-Cat 3 = 400-499 mm, and R-Cat 4 >500 mm). On average there have been 48, 9, 2 and 1 events per year, respectively, that reach these thresholds in the conterminous United States. The spatial distribution of maximum rankings for observations at all 5877 COOP sites is shown in the attached figure. This analysis shows that "… extreme precipitation events in the mountains of California are found to be comparable with the strongest events elsewhere nationally, which occur in the southeastern United States (including Texas)." The California storms are predominantly due to land falling atmospheric rivers, while the events in the southeastern U.S. include the effects of land falling tropical storms and hurricanes. In addition to allowing a comparison of AR-related extreme precipitation on the US West Coast with extreme precipitation from hurricanes and other storm types elsewhere, this scaling could be helpful in communicating precipitation risks and event magnitudes to the public and for monitoring for trends in extreme precipitation event frequency nationally within a changing climate.