HMT Publication Notice
July 26, 2013
A journal article entitled: Intercomparison of Meteorological Forcing Data from Empirical and Mesoscale Model Sources in the N.F. American River Basin in northern Sierra Nevada, California, by N. E. Wayand, et all, was recently published in the June 2013 issue of the Journal of Hydrometeorology.
The need for accurate meteorological driving data (temperature, precipitation, solar radiation etc.) has increased as the use of physically based distributed hydrological models have become more popular in order capture extreme weather events. Due to the current limited meteorological observations over the majority of western U.S. basins, missing observations are commonly estimated from another source (i.e. solar radiation empirically estimated from temperature and relative humidity or simulated precipitation from a mesoscale model). However, the best choice of what source to use for a given variable is not always straightforward and the user’s choice may significantly impact the quality of simulated snowpack and streamflow.
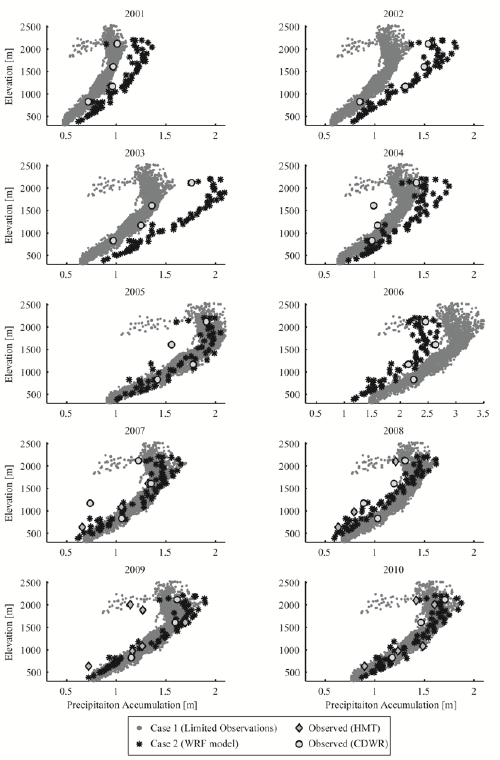
This article compares three common configurations of forcing data: 1) one low-elevation station, combined with empirical techniques, b) gridded output from the Weather Research and Forecasting (WRF) model, and c) a combination of the two. Each configuration was evaluated for ten years over the heavily-instrumented North Fork American River Basin in California using data from the NOAA Hydrometeorology Testbed (HMT). Simulations of streamflow and snowpack using the Distributed Hydrology Soil and Vegetation Model (DHSVM) highlighted precipitation and radiation as variables whose sources resulted in significant differences.
The best source of precipitation data varied between years. On average, the WRF model performed as well as the single station distributed using the Parameter Regression on Independent Slopes Model (PRISM). The average percent biases in simulated streamflow were 3% and 1%, for configurations a) and b) respectively, even though precipitation compared directly with gauge measurements was biased high by 6% and 17%, suggesting that gauge undercatch may explain part of the bias. Simulations of snowpack using empirically-estimated long-wave irradiance resulted in melt rates lower than those observed at high-elevation sites, while at lower-elevations the same forcing caused significant mid-winter melt that was not observed. These results highlight the complexity of how forcing data sources impact hydrology over different areas (high vs. low elevation snow) and different time-periods. Overall, results support the use of output from the WRF model over empirical techniques in regions with limited station data.
Contact: Mimi Hughes
Wayand, N.E., A.F. Hamlet, M. Hughes, S.I. Feld, and J.D. Lundquist, 2013: Intercomparison of Meteorological Forcing Data from Empirical and Mesoscale Model Sources in the North Fork American River Basin in Northern Sierra Nevada, California. J. Hydrometeor., 14, 677–699, doi:10.1175/JHM-D-12-0102.1