|
|
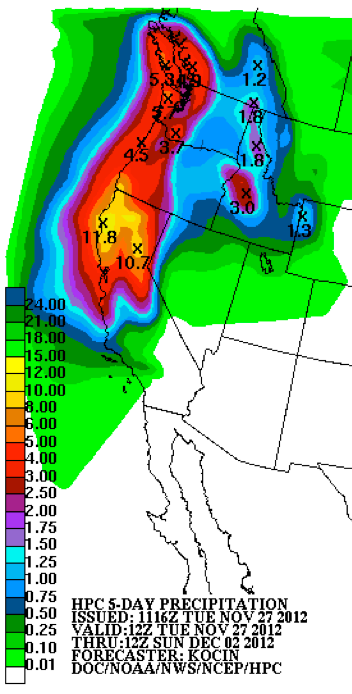
Fig. 1
|
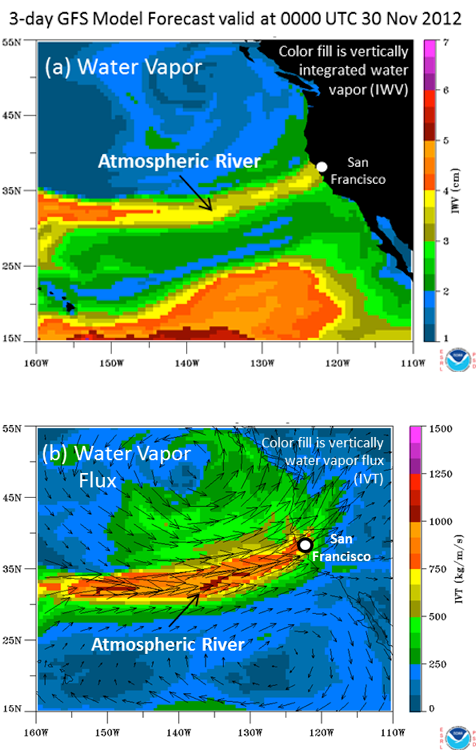
Fig. 2
|
|
Click Images for More Detail
Contacts:
|
|
Heavy Precipitation Event Developing in Northern California
HMT has identified the key role of ARs and has developed, tested, and implemented major new capabilities to monitor and predict them. Figure 2 shows the forecast for a strong AR at a specific time, while a loop of the forecasts over time is available on the Atmospheric River Information page. The National Weather Service has begun applying this concept in the forecast process, based heavily on lessons from HMT (e.g., through an Atmospheric River Retrospective Forecast Experiment). Highlights of the approaching atmospheric rivers are provided by new tools and research:
- Automated Atmospheric River Detection Tool: Uses integrated water vapor (IWV) satellite observations and numerical model forecasts to identify AR events (published by Wick et al. 2012);
- A 21st Century AR Monitoring Network: Inspired by HMT and currently being installed in California for "Enhanced Flood Response and Emergency Preparedness" sponsored by the California Department of Water Resources. For example, these real-time data show that the soil moisture has increased in the Russian River basin in the last few weeks due to early season storms and could reach saturation early in the event.
- Determination that the duration of continuous AR conditions at a given location is key to distinguishing flood-producing events: Ralph et al. (2012) documented that AR events lasting more than 40 hours were associated with 6 times as much streamflow on the Russian River than average AR events that last half as long (20 hours). The paper is in press and available online. The results will be presented at an invited talk at the American Geophysical Union Fall meeting in San Francisco, CA on 3 December 2012.
- Prototype Ensemble AR Prediction Tool: As a step toward visualizing and quantifying the duration of AR conditions at sites along the US West Coast, this tool was developed through HMT and led by Jason Cordeira. It uses the GFS Ensemble Forecast System to calculate the probability of AR conditions of differing magnitudes striking the west coast. It also determines how many 12-hour-long periods experience AR conditions as a function of position along the coast.
- 7-Day Quantitative Precipitation Forecasts: Previously issued only to 5 days, the NWS Hydrometeorological Prediction Center (HPC) now issues the 7-day forecasts in experimental mode. This is described in a journal article by White et al. (2012).
The accompanying animation of model-forecast IWV initialized on Tuesday 27 November 2012, and running through Wednesday 5 December 2012 shows AR conditions stalling over the Central and Northern California Coast for up to 2-3 days. However, the details of this forecast are likely to change as the event progresses, and important questions remain about exactly where it will strike and for how long. Stay tuned to the National Weather Service for up-to-date forecasts.
For background information on atmospheric rivers, and a publication list with the references listed above, please see the NOAA Atmospheric River Information Page.