
Figure 1. 14-day observed precipitation in the Western U.S. (Courtesy, NWS Advanced Hydrologic Prediction Service)
|

Figure 2. A composite of cloud images (left) and vertically integrated water vapor (right) taken by a constellation of weather satellites. The image shows the AR striking the southern California coast on Dec. 18-20.
|
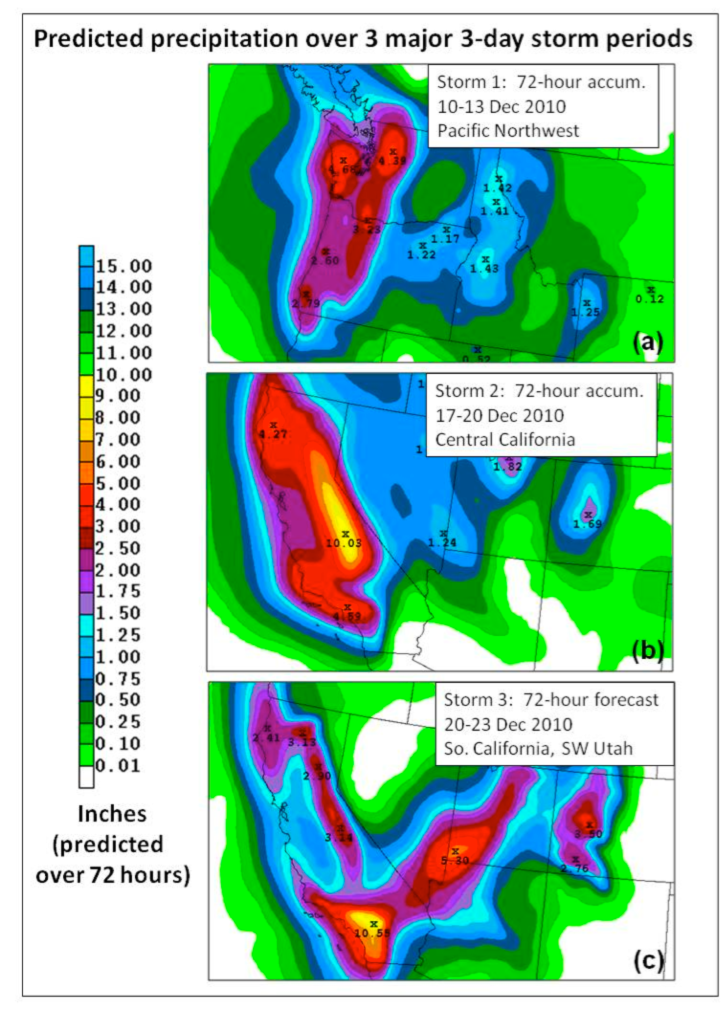
Figure 3. HPC 3-day precipitation forecasts (in inches). These forecasts were issued a) 9 Dec at 1350 PST, b) 17 Dec at 0151 PST, and c) 20 Dec at 0202 PST.
|
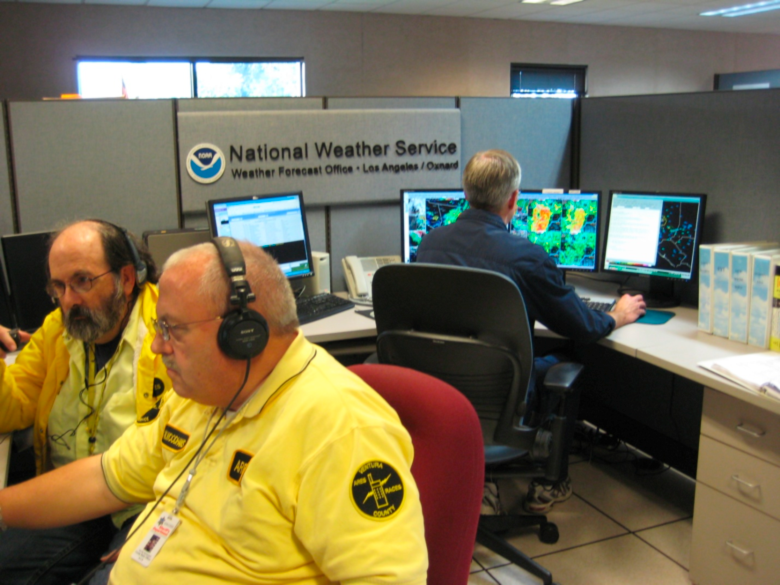
(Foreground) HAM radio operators from the Ventura County Auxiliary Communication Service and Amateur Radio Emergency Service sitting in the operations area of the Los Angeles Weather Forecast Office (WFO) on 22 Dec 2010. The HAM radio operators receive and solicit hazardous weather reports during storm events. Sitting in the background is Eric Boldt, the Warning Coordination Meteorologist for the Los Angeles WFO.
|
Series of Atmospheric Rivers Strike West Coast: Forecasters and Researchers Focus on Flood-Producing Storms
Dave Reynolds, meteorologist-in-charge of the National Weather Service's (NWS) San Francisco Weather Forecast Office (WFO), said NWS operational forecasters were well prepared for these events in part because of enhanced awareness and improved understanding of the role of ARs. Reynolds recently presented an online briefing to NWS Western Region staff on the AR phenomenon and related scientific advances. These advances, led by NOAA's Physical Sciences Division (PSD) in Boulder, Colo., were conducted under HMT, and used modern satellite and other observational tools to reveal the importance of ARs to both flooding and water supply in the region.
The first of these storms produced up to 11 inches of rain in the mountains of western Washington and localized flooding from Dec. 10-12. The second set of storms produced more than 25 inches of rain in the San Bernardino Mountains of southern California from Dec. 17-22, and upwards of 10-15 feet of snow in the southern Sierra Nevada Mountains (see map of 14-day observed precipitation - Fig. 1). In addition to flooding in Washington and California, these storms produced 16 inches of rainfall in the mountains of southern Utah. Flooding along the Virgin River in southern Utah caused serious property damage and damage to the earthen Trees Branch Dam along the Virgin River near Springdale, Utah.
In the case of the southern California and Utah areas, a strong AR stalled in the region for several days (see Fig. 2), providing an apparent connection to tropical water vapor near Hawaii (which also experienced flooding).
As part of NOAA's standard procedures for issuing precipitation and stream flow forecasts, quantitative precipitation forecasts (QPF) were produced in a collaborative effort between the Hydrometeorological Prediction Center (HPC), the Northwest River Forecast Center (NWRFC), the California River Forecast Center (CNRFC), and the local NWS WFOs in the region. These QPFs were then transformed into quantitative stream flow forecasts for key watersheds by the CNRFC and NWRFC.
While key aspects of these forecasts were quite accurate, gaps remain in predicting the exact timing, location and amounts of precipitation. Also, uncertainty remains about the fate of ARs in a changing climate (stronger/weaker; more or less frequent, etc...), and thus research continues on ARs and their associated impacts.
After months of preparation, and with project support from NOAA's Office of Hydrologic Development, the California Energy Commission (CEC), the U.S. Weather Research Program (USWRP), and California's Department of Water Resources (CA-DWR), engineers and scientists were sent into the storms to make unique observations with experimental radars, weather balloons and other sensors, while state-of-the-art numerical models provided detailed forecasts.
This experiment is part of ongoing HMT research, combined with a related study of the climate implications of ARs (called "CalWater"). CalWater, a project jointly sponsored by the CEC and NOAA, is studying how well ARs are represented in climate models, and how might AR amplitudes, frequencies, and locations vary in a changing climate.
"These data will advance understanding of the interaction of ARs with the mountains of the West Coast and to help develop advanced tools for predicting related heavy precipitation and flooding," said Marty Ralph, chief of PSD's Water Cycle Branch. Some of the experimental models and observations can be seen real-time on the HMT-West 2011 project page. Ralph's group also recently launched a site for additional information about atmospheric rivers.
By the time the first storms hit the Washington Coast Dec. 10-12, QPFs produced by HPC (Fig 3a) provided good guidance that heavy rain was on its way, and the river hydrographs then produced by NWRFC gave ample warning for the flooding that ensued. HPC, NOAA's Environmental Modeling Center (EMC), NWRFC, and Seattle WFO produced specialized precipitation and hydrologic forecasts for many western Washington river basins including the Green River Basin near Seattle because of the limited flood prevention capability provided by the damaged Howard A. Hanson Dam. A video was taken on Dec. 12 of the flooding that occurred on the Stillaquamish River at Granite Falls, Washington.
On Dec. 17, when central and southern California were hit by the next series of powerful storms, weather forecasters were armed with a similar set of tools from HPC, EMC and CNRFC, including remarkable precipitation forecasts (Figs. 3b and 3c) of more than 10 inches in 72 hours for both Dec. 17-20 and Dec. 20-23.
Experts noted the strong connection of this AR to tropical water vapor supply in and around the Hawaiian islands, where 6-9 inches of rain fell from Dec. 19-20 with Honolulu reporting 6.5 inches. Hawaii often experiences heavy rain during La Niña winters, but it is unusual for southern California to experience such heavy rain events during La Niña. It is likely that the persistence of this event was aided by a strong negative Arctic Oscillation (AO) that can contribute to strong blocking or persistence of upper level troughs and ridges contributing to anomalous weather. Therefore, the combination of the La Niña and negative AO likely contributed to this low latitude and persistent AR pattern in southern California and may also help to explain why Europe experienced severe travel restrictions because of heavy snow.
Satellite techniques that are used to monitor ARs over the oceans do not work well over land, and no regular measurements of winds in ARs over the ocean are made today. Thus, NOAA researchers are installing a permanent 21st century observing network across California that will help monitor ARs as they strike the coast and move inland, by measuring both winds and water vapor. Initial sites in this network already are providing data that can be compared with forecast models, which allows for adjustments in predictions of the strength and position of the ARs, conditions that are crucial to determining when and where the most extreme precipitation will occur.
This project, sponsored by the CA-DWR, also involves atmospheric and hydrologic modeling, specialized display systems, and the development of decision support tools. Building on lessons learned by the HMT in California, a smaller but similar set of instrumentation also has been installed temporarily in western Washington to aid forecasters in dealing with AR-driven extreme events in that region.
Story contributions by:
Marty Ralph1, Allen White1, Tim Schneider1, Dave Reynolds2, Ted Buehner3, Rob Hartman4, Andy Edman5, Jim Hoke6, Keith Brill6, and Gary Carter7
- 1NOAA Earth System Research Laboratory, Physical Sciences Division, Boulder, CO
- 2NOAA/NWS San Francisco Bay Area Weather Forecast Office, Monterey, CA
- 3NOAA/NWS Seattle Weather Forecast Office, Seattle, WA
- 4NOAA/NWS California/Nevada River Forecast Center, Sacramento, CA
- 5NOAA/NWS Western Region Headquarters, Salt Lake City, UT
- 6NOAA/NWS Hydrometeorological Prediction Center, Camp Springs, MD
- 7NOAA/NWS Office of Hydrologic Development, Silver Spring, MD