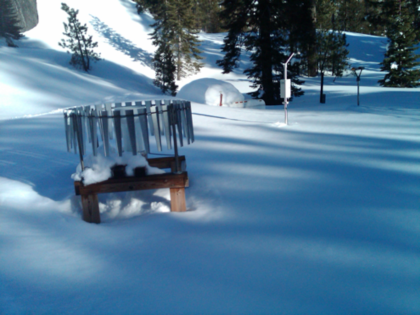
10 feet of snow at HMT/CalWater site at Big Bend, CA. Precipitation gage with wind screen (foreground). Instrument trailer is beneath snow pile in background. Photo by Clark King (NOAA/PSD) about 1 March 2011.
|

DOE/PNNL G-1 research aircraft carrying aerosol and microphysics payload during CalWater 2011. Photo with storm approaching McClellan air field near Sacramento, California. Photo by Marty Ralph (NOAA/PSD), 16 February 2011.
|
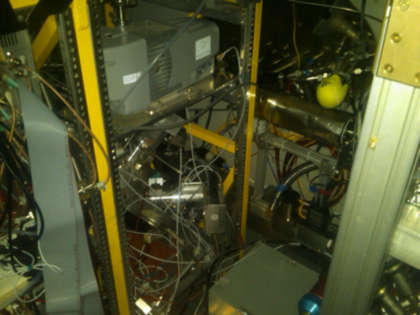
A small portion of the sensors onboard the G-1 research aircraft.
|

Sugar Pine Dam CalWater/HMT field site after snow. Photo by Clark King (NOAA/PSD) on about 1 March 2011.
|
CalWater and HMT-West Field Seasons Come to a Close
Phase AR: 1 Dec 2010 – 1 Feb 2011
- SkyWater radar operations
- Lincoln, Oakland and Reno soundings
- Unattended mesonet, including 7 AROs in northern and Central California, 3 S-Prof radar precipitation profilers
- New permanent mesonet sites installed under the DWR-sponsored EFREP/HMT-West Legacy Project, including 2-4 snow-level radars, several GPS-met sites and soil moisture sites
Phase AR+AP: 2 Feb – 6 Mar 2011
- Same as Phase AR, plus
- G-1 research aircraft, with
- ATOFMS aerosol sampler
- Continuous flow diffusion chamber for measuring ice nuclei
- Cloud microphysics sensors
- Aerosol size distribution sensors
- Water collection for isotope studies
- Gas phase analyzers
- Atmospheric thermodynamic sensors
- ATOFMS ground site at Sugar Pine Dam
Overall there were 7 AR/SBJ-focused IOPs, with 295 hours of SkyWater radar operations, and 87 special radiosondes launched (70 by PSD from Lincoln, plus 17 supplemental soundings by NWS from Oakland or Reno). During Phase AR+AP there were 28 flights of the PNNL G-1 aircraft, using 71 flight hours. The ATOFMS equipment, gas phase, and other meteorological instruments were operated at Sugar Pine Dam from Feb 1 to Mar 7. Precipitation samples were collected for the storms at 4 sites. A network of unattended equipment was in place from 1 December 2010 to 7 March 2011, and was made available in real-time via the web. In addition, specialized HMT numerical model simulations were conducted in real time, daily forecasts and field team deployment decisions were made throughout the period.
The success of the aircraft missions, SkyWater radar observations, detailed ground-based chemistry observations, serial balloon soundings, and water sampling during the CalWater field phase were highly dependent on the detailed forecast discussions provided by ESRL research meteorologists Ben Moore and Paul Neiman. These forecasts were disseminated in daily webinars and conference calls and were a key component in determining when and where to conduct the IOPs.
Overall the season produced the major meteorological and aerosol conditions that were required for CalWater and HMT-West to pursue their science objectives, including well above normal precipitation in the northern Sierra in December and late February. December 2010 was characterized by a series of intense ARs and heavy rain that affected California, although Central and Southern California bore the brunt of these storms. Some locations in the southern Sierra had received the equivalent of an entire season's snowpack, while the Northern Sierra 8-Station Index recorded 18 inches of accumulation, more than a third of the normal annual total. An extended AR-focused IOP was conducted in mid December. In contrast, January and the first half of February were quite dry, and no major IOPs were conducted. The dry period in early February proved useful in troubleshooting the complex system of sensors that had been installed on the G-1 aircraft. By the time significant precipitation returned to northern California on 14 February the full contingent of airborne and ground-based systems were operational. Over the next three weeks a series of storms struck the region, starting off unusually cold, and ending with warmer conditions. The cold conditions created heavy snow that made reaching the Sugar Pine Dam site difficult and impeded operations there and at a couple of other field sites. Overall, more than 20 inches of rain (or melted snow) fell at key CalWater/HMT sites in the Sierra on the 19 dates on which IOPs occurred. On these same 19 dates, over 120 inches of daily snow accumulation occurred at Norden in the Sierras, and snow depth reached over 10 feet at multiple experiment sites in the Sierra.
Aerosols from California and from Asia, as well as pristine maritime conditions were observed both in cloud and clear air, from the coastal ocean and mountains to the Central Valley and Sierra. 8 Sierra Barrier Jets (SBJ) were captured along with 6 AR events.
Also, two of the events monitored by CalWater/HMT in northern California were also monitored by aircraft well offshore as part of other programs' investigations of atmospheric rivers. On 11-12 February 2011 the first-ever scientific dropsonde mission of the NASA Global Hawk unmanned aircraft was conducted over the eastern Pacific, including two major transects over an AR northeast of Hawaii. This was part of the Winter Storms and Pacific Atmospheric Rivers experiment (WISPAR). On 3-4 March, the second Global Hawk dropsonde mission also sampled an AR over the ocean between Hawaii and California, while the NOAA G-IV aircraft conducted an AR-focused dropsonde leg with an AR "water vapor budget box." The NOAA G-IV was in Hawaii for NOAA's Winter Storms Reconnaissance Program and was able to conduct the special AR sampling through coordination with the WISPAR experiment. A third dropsonde flight was conducted by the Global Hawk on 8-9 March, and also sampled an AR.
In short, CalWater and HMT-West successfully captured unique experimental observations in the range of weather and aerosol conditions that were needed to pursue their science objectives. This has been possible due to the hard work, creativity and perseverance of staff from several organizations, and due to the investments from key sponsors of the experiments at CEC, NOAA and Scripps.
While the completion of the major field phase this winter is a major milestone, the hard work of quality control, analysis, synthesis, presentation and publication of results from these data and numerical modeling efforts remains ahead. These data, and the science team examining it, should generate a lasting impact on precipitation science, from the influence of aerosols to the role of ARs and the SBJ.