Figure 7 from paper: (a)–(h) Mean daily ΔSWE (cm day—1) anomaly relative to the cold-season (November–March) mean composited over each MJO phase during WY 1998–2010. Only strong MJOs (amplitude ≥1) are included in the calculation. The eight MJO phases are plotted counterclockwise, with the bottom left being phase 1. Positive numbers are in green and negative values are in brown. The range of the values is shown in square brackets. Dark colors indicate statistical significance at the 95% level based on Monte Carlo simulation. (i) Mean daily ΔSWE (cm day—1) during the cold season.
Click image for more detail
Contact:  Marty Ralph
July 13, 2012

HMT Publication Notice

A journal article entitled Does the Madden-Julian Oscillation Influence Wintertime Atmospheric Rivers and Snowpack in the Sierra Nevada?, by Bin Guan, Duane E. Waliser, Noah P. Molotch, Eric J. Fetzer, and Paul J. Neiman, was recently published in Monthly Weather Review, 140, 325–342.

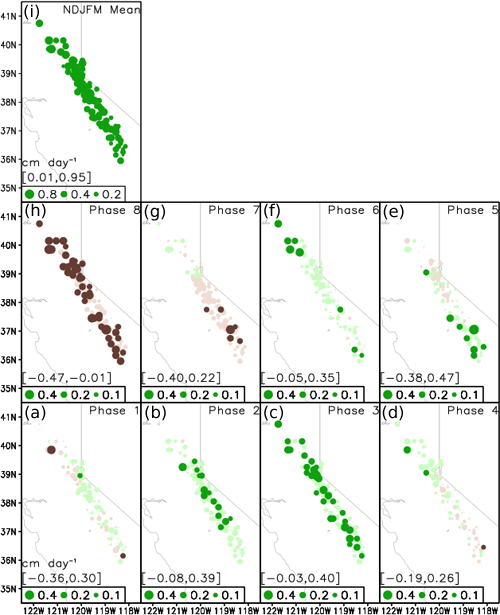
This observational study explores the impacts of the Madden-Julian Oscillation (MJO) on the Sierra Nevada snowpack, with a focus on related atmospheric river (AR) activities. AR activities are found to be significantly enhanced during MJO phase 6 (based on the Wheeler-Hendon diagram). The total seasonal snow accumulation, on the other hand, is most significantly modified by MJO phase 3 with increased snow accumulation, and by phase 8 with decreased snow accumulation. The results may have implications on the medium-range predictability of the Sierra Nevada snowpack and California water resources given that useful forecasts of the MJO can be made empirically at 2–3 weeks lead. This work has been conducted under partnership with the CalWater experiment. Primary support is provided by NASA, NSF, and ARRA funds.

arrow  Read the Abstract


404 Not Found

404 Not Found


nginx/1.25.5