HMT Researchers Develop New Methodology to Estimate Rainfall From X-band Radar Observations
October 30, 2013
HMT researchers recently published a paper outlining a new methodology for estimating rainfall from X-band radar measurements. The paper, Precipitation Classification and Quantification Using X-Band Dual-Polarization Weather Radar: Application in the Hydrometeorology Testbed, by Dr. S. Lim (now affiliated with the Korea Institute of Construction Technology) and coauthors was published in the September issue of the Journal of Atmospheric and Oceanic Technology.
The paper outlines a new method for rainfall estimation from X-band dual-polarization radar observations as well as advanced techniques for quality control, hydrometeor classification (rain vs. snow, etc.), and estimation of specific differential phase (an important parameter derived from dual pol radar observations for rainfall estimation).
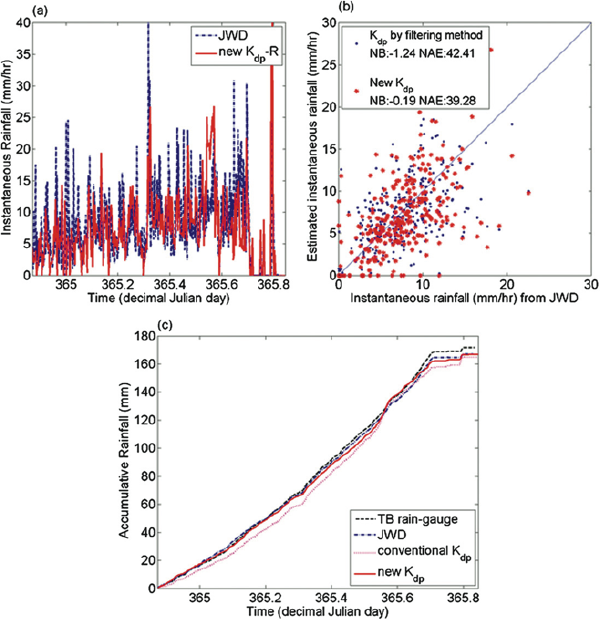
Data collected from HMT-West were used to demonstrate the methodology. The quality control and hydrometeor classification are specifically developed for X-band applications. Based on the specific differential phase, rainfall was calculated using data obtained from the NOAA HYDROX radar and evaluated using HMT rain gauge observations. The results show that the methodology works well at capturing the high-frequency rainfall variations for the events analyzed and can be useful for mountainous terrain applications.
Contact: Rob Cifelli
Lim, S., R. Cifelli, V. Chandrasekar, and S.Y. Matrosov, 2013: Precipitation Classification and Quantification Using X-Band Dual-Polarization Weather Radar: Application in the Hydrometeorology Testbed. J. Atmos. Oceanic Technol., 30, 2108–2120, doi:10.1175/JTECH-D-12-00123.1.