Observational and Modeling Tools Aid Forecasters During Epic California Winter
February 23, 2017
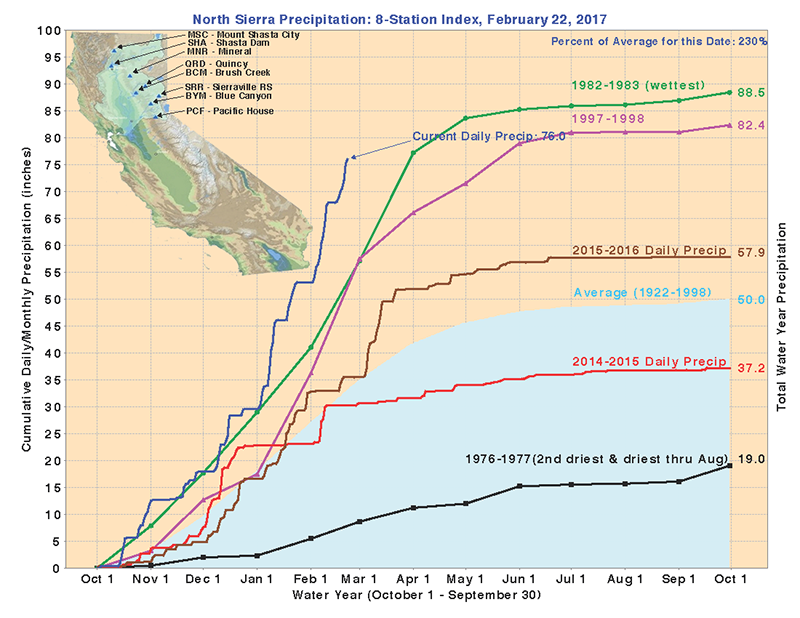
Lives have been lost, and roads and property damaged this winter as a number of storms battered northern California, causing record precipitation as well as numerous floods, mudslides, and debris flows. Earlier this month, over 150,000 residents living downstream from Oroville Dam were evacuated when officials used an emergency spillway to lower the water level on Lake Oroville—for the first time since the nation's tallest dam was installed there in the early 1960's.
Most of California's heavy precipitation events are the result of atmospheric rivers (ARs), narrow bands of enhanced water vapor transported into the state by storms that form over the Pacific. In collaboration with the California Department of Water Resources (DWR), NOAA has installed, operates, and maintains a state-of-the-art observing network that helps California monitor these storms.
"This ongoing collaboration greatly enhances and facilitates our flood planning and response efforts, integrated water management, and climate change tracking activities for the state," said Mike Anderson, California State Climatologist at DWR.
Atmospheric rivers can be detected by satellites and are also found in forecast models. However, they can be unpredictable because when the storms hit land, coastal and inland mountain ranges can trigger processes that intensify precipitation. During a typical winter wet season (usually November through March), California may receive a half dozen or so ARs. But by mid-February this year, northern California had already been impacted by 21 separate AR events, going back to October.
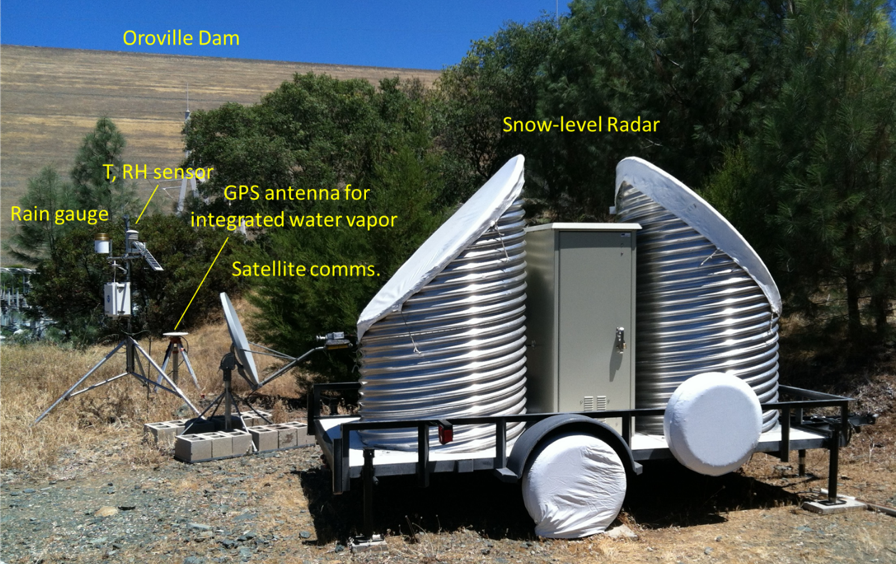
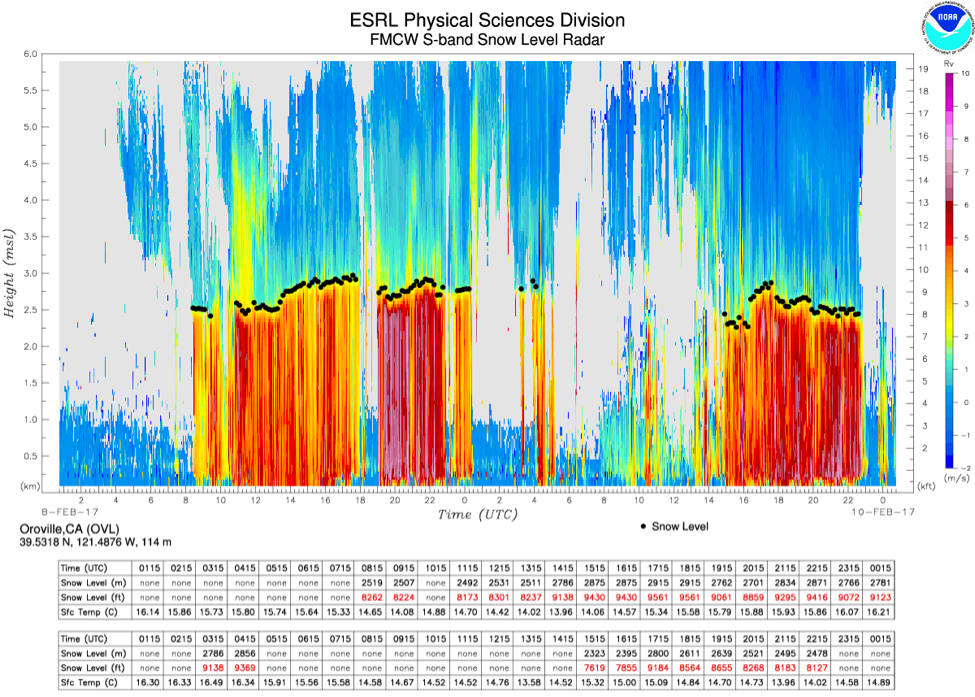
The NOAA-California DWR observing network helps scientists, forecasters, and emergency planners better understand these storms and their effects. For example, some instruments in the observing network are positioned to help forecasters detect and monitor key storm conditions impacting the Feather River watershed above Oroville Dam. One of these instruments is a snow-level radar that measures the altitude at which snow melts into rain in the atmosphere.
"The snow level is particularly important because it determines the extent of a watershed that is exposed to rain versus snow," said research meteorologist Allen White of the NOAA ESRL Physical Sciences Division (PSD). "Rain falling on snow or bare ground can enhance runoff and increase the threat of flooding, whereas more snow falling in the watershed buffers the flooding impact of storms."
The snow-level radar was developed at PSD to support National Weather Service (NWS) operations. This portable, relatively inexpensive radar has unique capabilities—not otherwise available from the NWS operational radar network—to monitor watershed conditions. This provides forecasters with crucial situational awareness about the impact of these storms.
Another collection of instruments installed upwind of the watershed is referred to as an atmospheric river observatory (ARO). The ARO, also developed at PSD, provides key measurements of atmospheric rivers, such as upslope winds and water vapor. A forecast tool associated with the ARO, the Water Vapor Flux Tool, allows forecasters to compare observations of an atmospheric river with weather forecasts.
Data from all of these instruments, along with measurements from soil moisture sensors and rain gauges, are transmitted to PSD via satellite or cellular services, where data visualization products are produced and displayed online in near real time to forecast offices and the general public.