Unusually Large Number of Atmospheric Rivers Impacted California this Past Winter
July 20, 2017
Rain and snow were a welcome relief in California this past winter, after a multi-year drought severely depleted the state's water resources. Parts of the state saw record amounts of precipitation, filling reservoirs, but also causing dangerous floods and landslides that led to two Presidential Disaster Declarations. The source of water for many of of these storms were atmospheric rivers. Research has shown that these narrow plumes of enhanced moisture transport in the atmosphere supply up to 50 percent of the annual precipitation—and an unusually large number occurred this past winter.
Because of decades of improvements in weather and river forecasting, and early engagement of emergency managers, loss of human life during these high impact events was kept to a minimum. These improvements are due in part to research that aims to better understand and characterize the processes that lead to atmospheric rivers and other extremes.
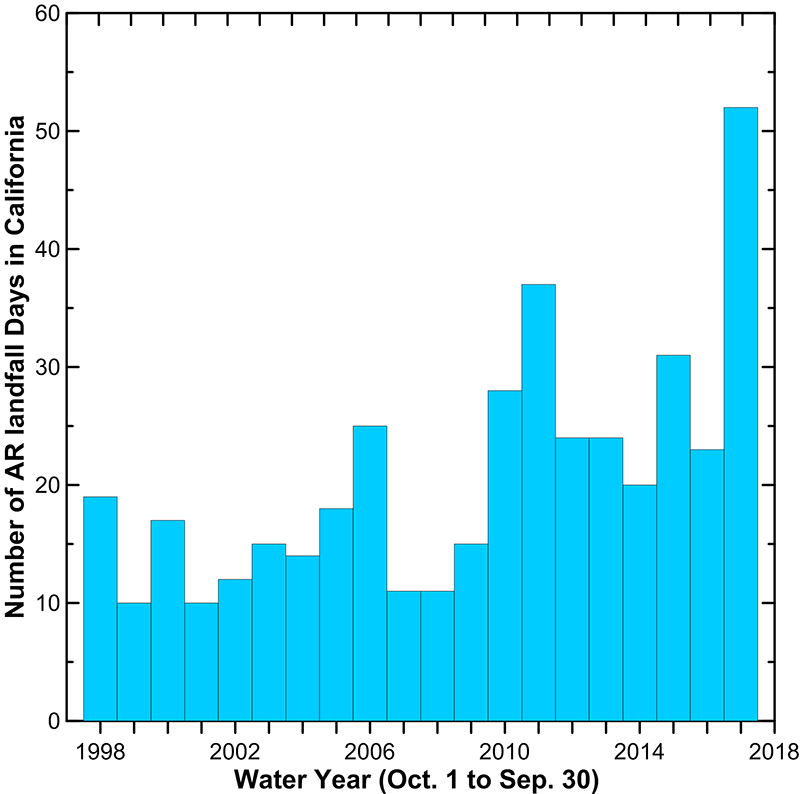
For the past 19 years, scientists from the NOAA ESRL Physical Sciences Division (PSD) have provided an annual climatology of atmospheric rivers, using satellite data from the Defense Meteorology Satellite Program. They recently completed an analysis of the the Fall/Winter wet season of 2016-17, which shows that an atmospheric river made landfall somewhere along the California coast a total of 52 days between October 1 and May 30. This also represents a record water year (October 1 through September 30) for the 20 years that these satellite measurements have been available. Figure 1 shows how the 2016-17 water year compares to other years in the 20-year record.
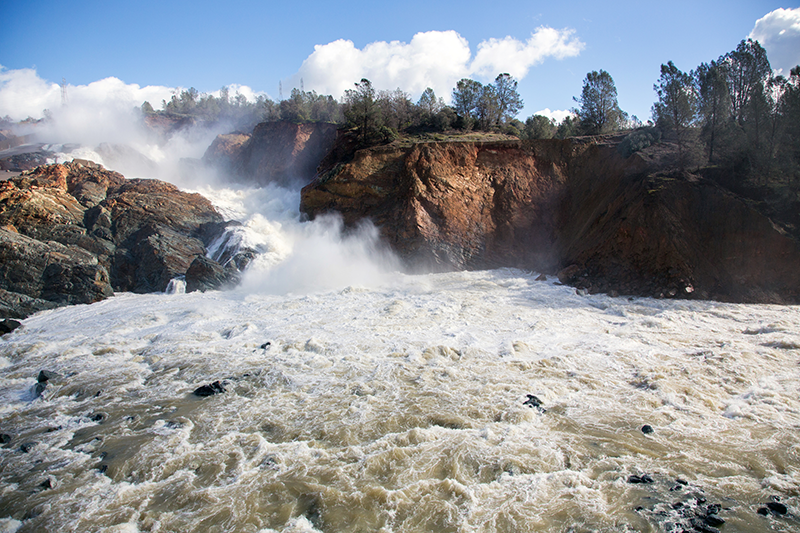
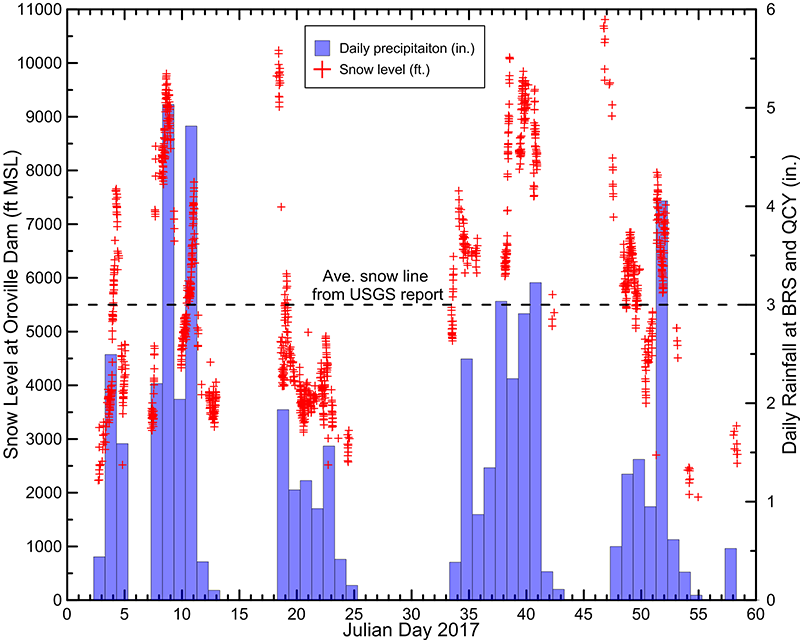
Because they often are accompanied by higher-than-normal snow levels, atmospheric rivers can exacerbate the threat of flooding in mountainous regions. Snow level—the altitude in the atmosphere at which snow melts into rain—is an important variable for mountain hydrology because it determines the area of a watershed that will be exposed to snow versus rain, or the amount of liquid water that is available for runoff. Because atmospheric rivers originate in warmer parts of midlatitude storms forming over the Pacific, they bring relatively warm, moist marine air into California. This warm, moist air brings heavy precipitation and high snow levels to the state's coastal mountains and even the Sierra Nevada range. This was especially true this past winter, when the northern Sierra experienced unusually heavy rainfall and ensuing runoff during January and early February. Typically, the area would have seen a mixture of snow and rain events. These heavy rains filled Lake Oroville to dangerously high levels and damaged the Oroville Dam's spillway, causing the evacuation of nearly 200,000 people.
Using observations they've collected along the West Coast, PSD researchers have conducted numerous studies over the years and now they will be working to understand why the 2016-17 winter season was so wet in California. Advancing knowledge about the large-scale processes controlling the location frequency and intensity of atmospheric rivers and their impacts will help improve weather forecasts, and lead to better water resource management and emergency preparedness.